3 posts tagged with "dbt"

View All Tags

· 9 min read
Aman Gupta
info

TL;DR: This article compares deploying dbt-core standalone and using dlt-dbt runner on Google Cloud Functions. The comparison covers various aspects, along with a step-by-step deployment guide.

dbt or “data build tool” has become a standard for transforming data in analytical environments. Most data pipelines nowadays start with ingestion and finish with running a dbt package.

dlt or “data load tool” is an open-source Python library for easily creating data ingestion pipelines. And of course, after ingesting the data, we want to transform it into an analytical model. For this reason, dlt offers a dbt runner that’s able to just run a dbt model on top of where dlt loaded the data, without setting up any additional things like dbt credentials.

Using dbt in Google Cloud functions

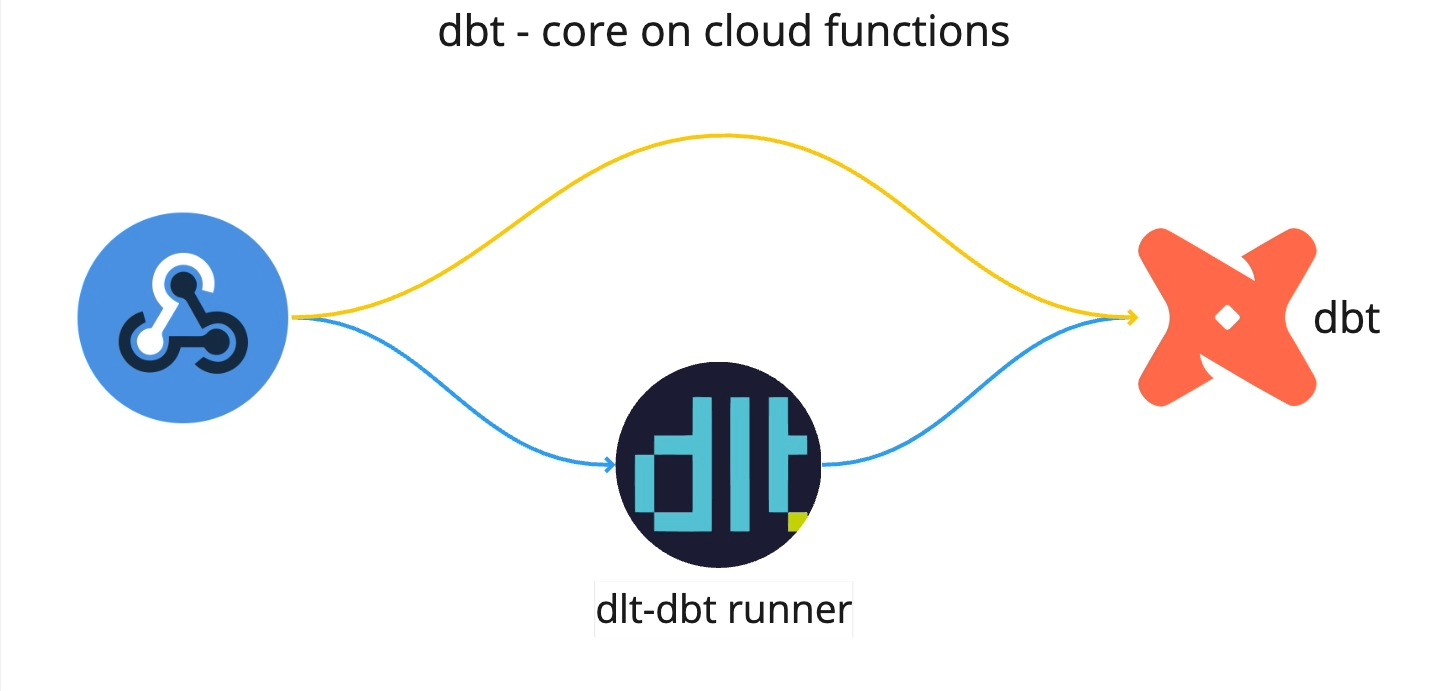
To use dbt in cloud functions, we employed two methods:

  1. dbt-core on GCP cloud functions.
  2. dlt-dbt runner on GCP cloud functions.

Let’s discuss these methods one by one.

1. Deploying dbt-core on Google Cloud functions

Let's dive into running dbt-core up on cloud functions.

You should use this option for scenarios where you have already collected and housed your data in a data warehouse, and you need further transformations or modeling of the data. This is a good option if you have used dbt before and want to leverage the power of dbt-core. If you are new to dbt, please refer to dbt documentation: Link Here.

Let’s start with setting up the following directory structure:

dbt_setup
|-- main.py
|-- requirements.txt
|-- profiles.yml
|-- dbt_project.yml
|-- dbt_transform
|-- models
| |-- model1.sql
| |-- model2.sql
| |-- sources.yml
|-- (other dbt related contents, if required)

You can setup the contents in dbt_transform folder by initing a new dbt project, for details refer to documentation.

note

We recommend setting up and testing dbt-core locally before using it in cloud functions.

To run dbt-core on GCP cloud functions:

  1. Once you've tested the dbt-core package locally, update the profiles.yml before migrating the folder to the cloud function as follows:

    dbt_gcp: # project name
    target: dev # environment
    outputs:
    dev:
    type: bigquery
    method: oauth
    project: please_set_me_up! # your GCP project name
    dataset: please_set_me_up! # your project dataset name
    threads: 4
    impersonate_service_account: please_set_me_up! # GCP service account

    This service account should have bigquery read and write permissions.

  2. Next, modify the main.py as follows:

    import os
    import subprocess
    import logging

    # Configure logging
    logging.basicConfig(level=logging.INFO)

    def run_dbt(request):
    try:
    # Set your dbt profiles directory (assuming it's in /workspace)
    os.environ['DBT_PROFILES_DIR'] = '/workspace/dbt_transform'

    # Log the current working directory and list files
    dbt_project_dir = '/workspace/dbt_transform'
    os.chdir(dbt_project_dir)

    # Log the current working directory and list files
    logging.info(f"Current working directory: {os.getcwd()}")
    logging.info(f"Files in the current directory: {os.listdir('.')}")

    # Run dbt command (e.g., dbt run)

    result = subprocess.run(
    ['dbt', 'run'],
    capture_output=True,
    text=True
    )

    # Return dbt output
    return result.stdout

    except Exception as e:
    logging.error(f"Error running dbt: {str(e)}")
    return f"Error running dbt: {str(e)}"
  3. Next, list runtime-installable modules in requirements.txt:

    dbt-core
    dbt-bigquery
  4. Finally, you can deploy the function using gcloud CLI as:

    gcloud functions deploy YOUR_FUNCTION_NAME \
    --gen2 \
    --region=YOUR_REGION \
    --runtime=python310 \
    --source=YOUR_SOURCE_LOCATION \
    --entry-point=YOUR_CODE_ENTRYPOINT \
    TRIGGER_FLAGS

    You have option to deploy the function via GCP Cloud Functions' GUI.

2. Deploying function using dlt-dbt runner

The second option is running dbt using data load tool(dlt).

I work at dlthub and often create dlt pipelines. These often need dbt for modeling the data, making the dlt-dbt combination highly effective. For using this combination on cloud functions, we used dlt-dbt runner developed at dlthub.

The main reason I use this runner is because I load data with dlt and can re-use dlt’s connection to the warehouse to run my dbt package, saving me the time and code complexity I’d need to set up and run dbt standalone.

To integrate dlt and dbt in cloud functions, use the dlt-dbt runner; here’s how:

  1. Lets start by creating the following directory structure:

    dbt_setup
    |-- main.py
    |-- requirements.txt
    |-- dbt_project.yml
    |-- dbt_transform
    |-- models
    | |-- model1.sql
    | |-- model2.sql
    | |-- sources.yml
    |-- (other dbt related contents, if required)

    You can set up the dbt by initing a new project, for details refer to documentation.

    note

    With the dlt-dbt runner configuration, setting up a profiles.yml is unnecessary. DLT seamlessly shares credentials with dbt, and on Google Cloud Functions, it automatically retrieves service account credentials, if none are provided.

  2. Next, configure the dbt_projects.yml and set the model directory, for example:

    model-paths: ["dbt_transform/models"]
  3. Next, configure the main.py as follows:

    import dlt
    import logging
    from flask import jsonify
    from dlt.common.runtime.slack import send_slack_message
    from dlt.common import json

    def run_pipeline(request):
    """
    Set up and execute a data processing pipeline, returning its status
    and model information.

    This function initializes a dlt pipeline with pre-defined settings,
    runs the pipeline with a sample dataset, and then applies dbt
    transformations. It compiles and returns the information about
    each dbt model's execution.

    Args:
    request: The Flask request object. Not used in this function.

    Returns:
    Flask Response: A JSON response with the pipeline's status
    and dbt model information.
    """
    try:
    # Sample data to be processed
    data = [{"name": "Alice Smith", "id": 1, "country": "Germany"},
    {"name": "Carlos Ruiz", "id": 2, "country": "Romania"},
    {"name": "Sunita Gupta", "id": 3, "country": "India"}]

    # Initialize a dlt pipeline with specified settings
    pipeline = dlt.pipeline(
    pipeline_name="user_data_pipeline",
    destination="bigquery",
    dataset_name="dlt_dbt_test"
    )

    # Run the pipeline with the sample data
    pipeline.run(data, table_name="sample_data")

    # Apply dbt transformations and collect model information
    models = transform_data(pipeline)
    model_info = [
    {
    "model_name": m.model_name,
    "time": m.time,
    "status": m.status,
    "message": m.message
    }
    for m in models
    ]

    # Convert the model information to a string
    model_info_str = json.dumps(model_info)

    # Send the model information to Slack
    send_slack_message(
    pipeline.runtime_config.slack_incoming_hook,
    model_info_str
    )

    # Return a success response with model information
    return jsonify({"status": "success", "model_info": model_info})
    except Exception as e:
    # Log and return an error response in case of any exceptions
    logging.error(f"Error in running pipeline: {e}", exc_info=True)

    return jsonify({"status": "error", "error": str(e)}), 500

    def transform_data(pipeline):
    """
    Execute dbt models for data transformation within a dlt pipeline.

    This function packages and runs all dbt models associated with the
    pipeline, applying defined transformations to the data.

    Args:
    pipeline (dlt.Pipeline): The pipeline object for which dbt
    transformations are run.

    Returns:
    list: A list of dbt model run information, indicating the
    outcome of each model.

    Raises:
    Exception: If there is an error in running the dbt models.
    """
    try:
    # Initialize dbt with the given pipeline and virtual environment
    dbt = dlt.dbt.package(
    pipeline,
    "/workspace/dbt_transform",
    venv=dlt.dbt.get_venv(pipeline)
    )
    logging.info("Running dbt models...")
    # Run all dbt models and return their run information
    return dbt.run_all()
    except Exception as e:
    # Log and re-raise any errors encountered during dbt model
    # execution
    logging.error(f"Error in running dbt models: {e}", exc_info=True)
    raise

    # Main execution block
    if __name__ == "__main__":
    # Execute the pipeline function.
    run_pipeline(None)
  4. The send_slack_message function is utilized for sending messages to Slack, triggered by both success and error events. For setup instructions, please refer to the official documentation here.

    RUNTIME__SLACK_INCOMING_HOOK was set up as environment variable in the above code.

  5. Next, list runtime-installable modules in requirements.txt:

    dbt-core
    dbt-bigquery
  6. Finally, you can deploy the function using gcloud CLI as:

    gcloud functions deploy YOUR_FUNCTION_NAME \
    --gen2 \
    --region=YOUR_REGION \
    --runtime=python310 \
    --source=YOUR_SOURCE_LOCATION \
    --entry-point=YOUR_CODE_ENTRYPOINT \
    TRIGGER_FLAGS

The merit of this method is that it can be used to load and transform data simultaneously. Using dlt for data loading and dbt for modeling makes using dlt-dbt a killer combination for data engineers and scientists, and my preferred choice. This method is especially effective for batched data and event-driven pipelines with small to medium workloads. For larger data loads nearing timeout limits, consider separating dlt and dbt into different cloud functions.

For more info on using dlt-dbt runner , please refer to the official documentation by clicking here.

Deployment considerations: How does cloud functions compare to Git Actions?

At dlthub we already natively support deploying to GitHub Actions, enabling you to have a serverless setup with a 1-command deployment.

GitHub actions is an orchestrator that most would not find suitable for a data warehouse setup - but it certainly could do the job for a minimalistic setup. GitHub actions provide 2000 free minutes per month, so if our pipelines run for 66 minutes per day, we fit in the free tier. If our pipelines took another 1h per day, we would need to pay ~15 USD/month for the smallest machine (2 vCPUs) but you can see how that would be expensive if we wanted to run it continuously or had multiple pipelines always-on in parallel.

Cloud functions are serverless lightweight computing solutions that can handle small computational workloads and are cost-effective. dbt doesn't require the high computing power of the machine because it uses the computing power of the data warehouse to perform the transformations. This makes running dbt-core on cloud functions a good choice. The free tier would suffice for about 1.5h per day of running a 1 vCPU and 2 GB RAM machine, and if we wanted an additional 1h per day for this hardware it would cost us around 3-5 USD/month.
DLT-DBT-RUNNER_IMAGE

When deploying dbt-core on cloud functions, there are certain constraints to keep in mind. For instance, there is a 9-minute time-out limit for all 1st Gen functions. For 2nd Gen functions, there is a 9-minute limit for event-driven functions and a 60-minute limit for HTTP functions. Since dbt works on the processing power of the data warehouse it's operating on, 60 minutes is sufficient for most cases with small to medium workloads. However, it is important to remember the 9-minute cap when using event-driven functions.

Conclusion

When creating lightweight pipelines, using the two tools together on one cloud function makes a lot of sense, simplifying the setup process and the handover between loading and transformation.

However, for more resource-intensive pipelines, we might want to improve resource utilisation by separating the dlt loading from the dbt running because while dbt’s run speed is determined by the database, dlt can utilize the cloud function’s hardware resources.

When it comes to setting up just a dbt package to run on cloud functions, I guess it comes to personal preference: I prefer dlt as it simplifies credential management. It automatically shares credentials with dbt, making setup easier. Streamlining the process further, dlt on Google Cloud functions, efficiently retrieves service account credentials, when none are provided. I also used dlt’s Slack error reporting function that sends success and error notifications from your runs directly to your Slack channel, helping me manage and monitor my runs.

· 9 min read
Zaeem Athar
info

TL;DR: In this blog, we'll create a data lineage view for our ingested data by utlizing the dlt load_info.

Why data lineage is important?

Data lineage is an important tool in an arsenal of a data engineer. It showcases the journey of data from its source to its destination. It captures all the pitstops made and can help identify issues in the data pipelines by offering a birds eye view of the data.

As data engineers, data lineage enables us to trace and troubleshoot the datapoints we offer to our stakeholders. It is also an important tool that can be used to meet regulation regarding privacy. Moreover, it can help us evaluate how any changes upstream in a pipeline effects the downstream source. There are many types of data lineage, the most commonly used types are the following:

  • Table lineage, it shows the raw data sources that are used to form a new table. It tracks the flow of data, showing how data moves forward through various processes and transformations.
  • Row lineage reveals the data flow at a more granular level. It refers to tracking and understanding of individual rows of data as they move through various stages in a data processing pipeline. It is a subset of table lineage that focuses specifically on the journey of individual records or rows rather than the entire dataset.
  • Column lineage specifically focuses on tracking and documenting the flow and transformation of individual columns or fields within different tables and views in the data.

Project Overview

In this demo, we showcase how you can leverage the dlt pipeline load_info to create table, row and column lineage for your data. The code for the demo is available on GitHub.

The dlt load_info encapsulates useful information pertaining the loaded data. It contains the pipeline, dataset name, the destination information and list of loaded packages among other elements. Within the load_info packages, you will find a list of all tables and columns created at the destination during loading of the data. It can be used to display all the schema changes that occur during data ingestion and implement data lineage.

We will work with the example of a skate shop that runs an online shop using Shopify, in addition to its physical stores. The data from both sources is extracted using dlt and loaded into BigQuery.

Data Lineage Overview

In order to run analytics workloads, we will create a transformed fact_sales table using dbt and the extracted raw data. The fact_sales table can be used to answer all the sales related queries for the business.

The load_info produced by dlt for both pipelines is also populated into BigQuery. We will use this information to create a Dashboard in Metabase that shows the data lineage for the fact_sales table.

Implementing Data Lineage

To get started install dlt and dbt:

pip install dlt
pip install dbt-bigquery

As we will be ingesting data into BigQuery, we first need to create service account credentials for BigQuery. You can find more info on setting up a service account in the dlt docs.

We use the following CSV files as our data sources for this demo:

dlt provides verified Shopify source to directly extract data from the Shopify API.

Step 1: Initialize a dlt pipeline

To get started we initialize a dlt pipeline and selecting BigQuery as our destination by running the following command:

dlt init data_lineage bigquery

This will create default scaffolding to build our pipeline. Install the dependencies by running the following command:

pip install -r requirements.txt

Loading the data

As a first step, we will load the sales data from the online and physical store of the skate shop into BigQuery. In addition to the sales data, we will also ingest the dlt load_info into BigQuery. This will help us track changes in our pipeline.

Step 2: Adding the dlt pipeline code

In the data_lineage.py file remove the default code and add the following:

FILEPATH = "data/supermarket_sales.csv"
FILEPATH_SHOPIFY = "data/orders_export_1.csv"

class Data_Pipeline:
def __init__(self, pipeline_name, destination, dataset_name):
self.pipeline_name = pipeline_name
self.destination = destination
self.dataset_name = dataset_name

def run_pipeline(self, data, table_name, write_disposition):
# Configure the pipeline with your destination details
pipeline = dlt.pipeline(
pipeline_name=self.pipeline_name,
destination=self.destination,
dataset_name=self.dataset_name
)
# Run the pipeline with the provided data
load_info = pipeline.run(
data,
table_name=table_name,
write_disposition=write_disposition
)

# Pretty print the information on data that was loaded
print(load_info)
return load_info

Any changes in the underlying data are captured by the dlt load_info. To showcase this, we will filter the data to remove the Branch and Tags columns from Store and Shopify data respectively and run the pipeline. Later we will add back the columns and rerun the pipeline. These new columns added will be recorded in the load_info packages.

We will add the load_info back to BigQuery to use in our Dashboard. The Dashboard will provide an overview data lineage for our ingested data.

if __name__ == "__main__":

data_store = pd.read_csv(FILEPATH)
data_shopify = pd.read_csv(FILEPATH_SHOPIFY)

#filtering some data.
select_c_data_store = data_store.loc[
:, data_store.columns.difference(['Branch'])
]
select_c_data_shopify = data_shopify.loc[
:, data_shopify.columns.difference(['Tags'])
]

pipeline_store = Data_Pipeline(
pipeline_name='pipeline_store',
destination='bigquery',
dataset_name='sales_store'
)
pipeline_shopify = Data_Pipeline(
pipeline_name='pipeline_shopify',
destination='bigquery',
dataset_name='sales_shopify'
)

load_a = pipeline_store.run_pipeline(
data=select_c_data_store,
table_name='sales_info',
write_disposition='replace'
)
load_b = pipeline_shopify.run_pipeline(
data=select_c_data_shopify,
table_name='sales_info',
write_disposition='replace'
)

pipeline_store.run_pipeline(
data=load_a.load_packages,
table_name="load_info",
write_disposition="append"
)
pipeline_shopify.run_pipeline(
data=load_b.load_packages,
table_name='load_info',
write_disposition="append"
)

Step 3: Run the dlt pipeline

To run the pipeline, execute the following command:

python data_lineage.py

This will load the data into BigQuery. We now need to remove the column filters from the code and rerun the pipeline. This will add the filtered columns to the tables in BigQuery. The change will be captured by dlt.

Data Transformation and Lineage

Now that both the Shopify and Store data are available in BigQuery, we will use dbt to transform the data.

Step 4: Initialize a dbt project and define model

To get started initialize a dbt project in the root directory:

dbt init sales_dbt

Next, in the sales_dbt/models we define the dbt models. The first model will be the fact_sales.sql. The skate shop has two data sources: the online Shopify source and the physical Store source. We need to combine the data from both sources to create a unified reporting feed. The fact_sales table will be our unified source.

Code for fact_sales.sql:

{{ config(materialized='table') }}

select
invoice_id,
city,
unit_price,
quantity,
total,
date,
payment,
info._dlt_id,
info._dlt_load_id,
loads.schema_name,
loads.inserted_at
from {{source('store', 'sales_info')}} as info
left join {{source('store', '_dlt_loads')}} as loads
on info._dlt_load_id = loads.load_id

union all

select
name as invoice_id,
billing_city,
lineitem_price,
lineitem_quantity,
total,
created_at,
payment_method,
info._dlt_id,
info._dlt_load_id,
loads.schema_name,
loads.inserted_at
from {{source('shopify', 'sales_info')}} as info
left join {{source('shopify', '_dlt_loads')}} as loads
on info._dlt_load_id = loads.load_id
where financial_status = 'paid'

In the query, we join the sales information for each source with its dlt load_info. This will help us keep track of the number of rows added with each pipeline run. The schema_name identifies the source that populated the table and helps establish the table lineage. While the _dlt_load_id identifies the pipeline run that populated the each row and helps establish row level lineage. The sources are combined to create a fact_sales table by doing a union over both sources.

Next, we define the schema_change.sql model to capture the changes in the table schema using a following query:

{{ config(materialized='table') }}

select *
from {{source('store', 'load_info__tables__columns')}}

union all

select *
from {{source('shopify', 'load_info__tables__columns')}}

In the query, we combine the load_info for both sources by doing a union over the sources. The resulting schema_change table contains records of the column changes that occur on each pipeline run. This will help us track the column lineage and will be used to create our Data Lineage Dashboard.

Step 5: Run the dbt package

In the data_lineage.py add the code to run the dbt package using dlt.

pipeline_transform = dlt.pipeline(
pipeline_name='pipeline_transform',
destination='bigquery',
dataset_name='sales_transform'
)

venv = Venv.restore_current()
here = os.path.dirname(os.path.realpath(__file__))

dbt = dlt.dbt.package(
pipeline_transform,
os.path.join(here, "sales_dbt/"),
venv=venv
)

models = dbt.run_all()

for m in models:
print(
f"Model {m.model_name} materialized in {m.time} - "
f"Status {m.status} and message {m.message}"
)

Next, run the pipeline using the following command:

python data_lineage.py

Once the pipeline is run, a new dataset called sales_transform will be created in BigQuery, which will contain the fact_sales and schema_changes tables that we defined in the dbt package.

Step 6: Visualising the lineage in Metabase

To access the BigQuery data in Metabase, we need to connect BigQuery to Metabase. Follow the Metabase docs to connect BigQuery to Metabase.

Once BigQuery is connected with Metabase, use the SQL Editor to create the first table. The Data Load Overview table gives an overview of the dlt pipelines that populated the fact_sales table. It shows the pipeline names and the number of rows loaded into the fact_sales table by each pipeline.

Metabase Report

This can be used to track the rows loaded by each pipeline. An upper and lower threshold can be set, and when our pipelines add rows above or below the threshold, that can act as our canary in the coal mine.

Next, we will visualize the fact_sales and the schema_changes as a table and add the dlt_load_id as a filter. The resulting Data Lineage Dashboard will give us an overview of the table, row and column level lineage for our data.

Data Lineage Dashboard

When we filter by the dlt_load_id the dashboard will filter for the specific pipeline run. In the Fact Sales table the column schema_name identifies the raw sources that populated the table (Table lineage). The table also shows only the rows that were added for the pipeline run (Row Lineage). Lastly, the Updated Columns table revels the columns that were added for filtered pipeline run (Column Lineage).

When we ran the pipeline initially, we filtered out the Tags column and later reintroduced it and ran the pipeline again. The Updated Columns shows that the Tags column was added to the Fact Sales table with the new pipeline run.

Conclusion

Data lineage provides an overview of the data journey from the source to destination. It is an important tool that can help troubleshoot a pipeline. dlt load_info provides an alternative solution to visualizing data lineage by tracking changes in the underlying data.

Although dlt currently does not support data flow diagrams, it tracks changes in the data schema that can be used to create dashboards that provides an overview of table, row and column lineage for the loaded data.

· 10 min read
Rahul Joshi
info

TL;DR: I combined dlt, dbt, DuckDB, MotherDuck, and Metabase to create a Modern Data Stack in a box that makes it very easy to create a data pipeline from scratch and then deploy it to production.

I started working in dltHub in March 2023, right around the time when we released DuckDB as a destination for dlt. As a Python user, being able to create a data pipeline, load the data in my laptop, and explore and query the data all in python was awesome.

At the time I also came across this very cool article by Jacob Matson in which he talks about creating a Modern Data Stack(MDS) in a box with DuckDB. I was already fascinated with dlt and all the other new tools that I was discovering, so reading about this approach of combining different tools to execute an end-to-end proof of concept in your laptop was especially interesting.

Fast forward to a few weeks ago when dlt released MotherDuck as a destination. The first thing that I thought of was an approach to MDS in a box where you develop locally with DuckDB and deploy in the cloud with MotherDuck. I wanted to try it out.

What makes this awesome

In my example, I wanted to customize reports on top of Google Analytics 4 (GA4) and combine it with data from GitHub. This is usually challenging because, while exporting data from GA4 to BigQuery is simple, combining it with other sources and creating custom analytics on top of it can get pretty complicated.

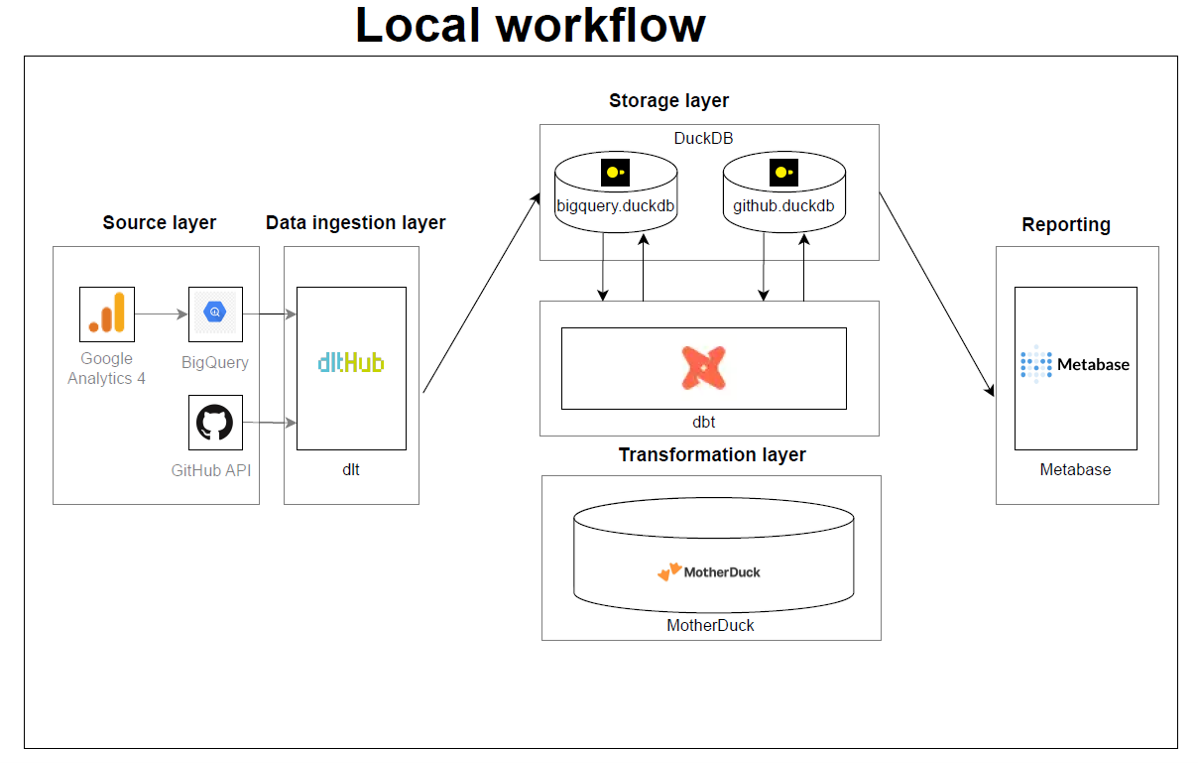
By first pulling all the data from different sources into DuckDB files in my laptop, I was able to do my development and customization locally.

local-workflow

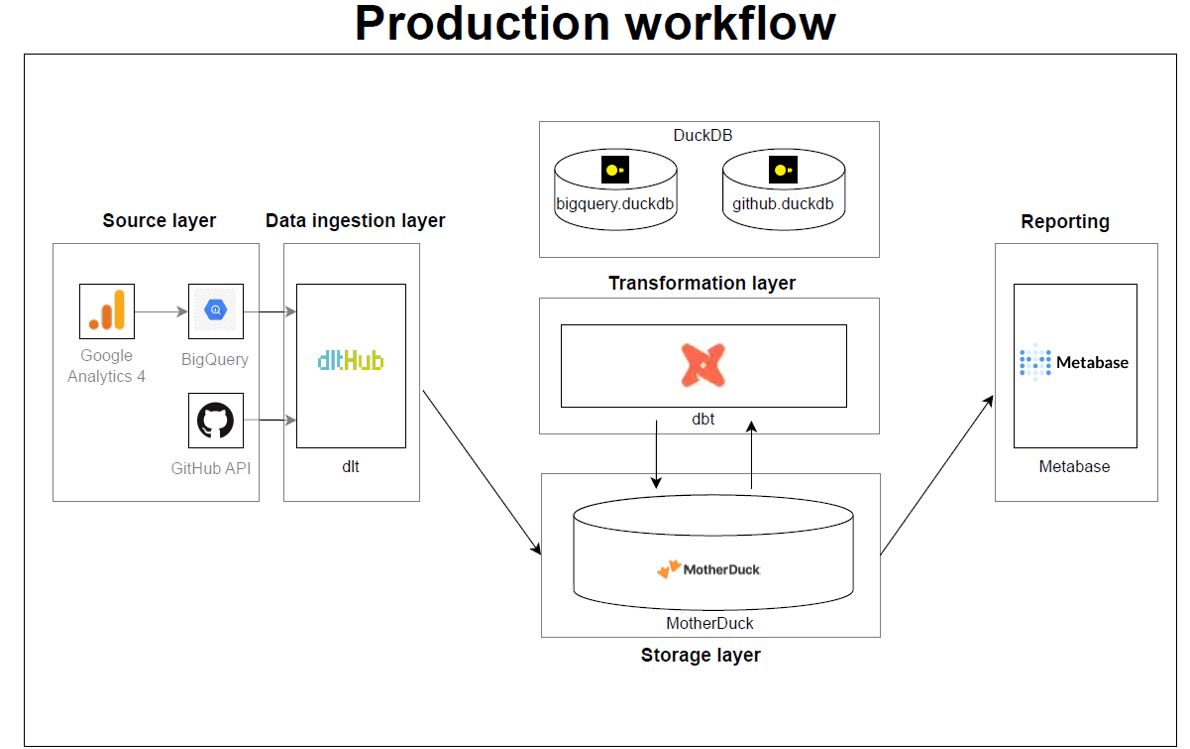
And then when I was ready to move to production, I was able to seamlessly switch from DuckDB to MotherDuck with almost no code re-writing!

production-workflow

Thus I got a super simple and highly customizable MDS in a box that is also close to company production setting.

What does this MDS in a box version look like?

ToolLayerWhy it’s awesome
dltdata ingestionridiculously easy to write a customized pipeline in Python to load from any source
DuckDBdata warehouse in your laptopfree, fast OLAP database on your local laptop that you can explore using SQL or python
MotherDuckdata warehouse in the cloudDuckDB, but in cloud: fast, OLAP database that you can connect to your local duckdb file and share it with the team in company production settings
dbtdata transformationan amazing open source tool to package your data transformations, and it also combines well with dlt, DuckDB, and Motherduck
Metabasereportingopen source, has support for DuckDB, and looks prettier than my Python notebook

How this all works

The example that I chose was inspired by one of my existing workflows: that of understanding dlt-related metrics every month. Previously, I was using only Google BigQuery and Metabase to understand dlt’s product usage, but now I decided to test how a migration to DuckDB and MotherDuck would look like.

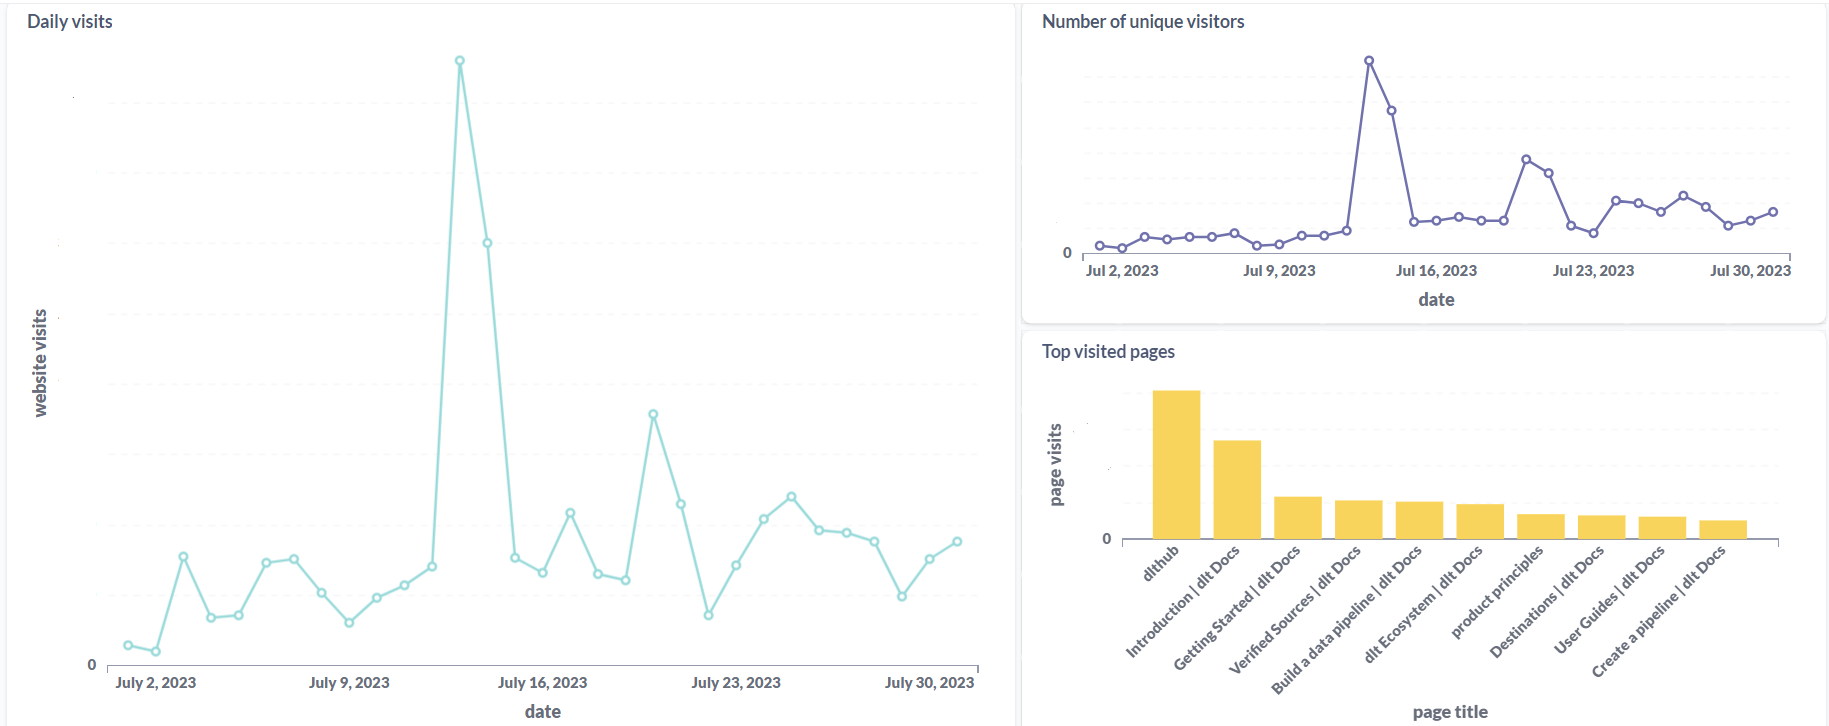
The idea is to build a dashboard to track metrics around how people are using and engaging with dlt on different platforms like GitHub (contributions, activity, stars etc.), dlt website and docs (number of website/docs visits etc.).

This is a perfect problem to test out my new super simple and highly customizable MDS in a box because it involves combining data from different sources (GitHub API, Google Analytics 4) and tracking them in a live analytics dashboard.

  1. Loading the data using dlt

    The advantage of using dlt for data ingestion is that dlt makes it very easy to create and customize data pipelines using just Python.

    In this example, I created two data pipelines:

    • BigQuery → DuckDB: Since all the Google Analytics 4 data is stored in BigQuery, I needed a pipeline that could load all events data from BigQuery into a local DuckDB instance. BigQuery does not exist as a verified source for dlt, which means that I had to write this pipeline from scratch.
    • GitHub API → DuckDB:
      dlt has an existing GitHub source that loads data around reactions, PRs, comments, and issues. To also load data on stargazers, I had to modify the existing source.

    dlt is simple and highly customizable:

    • Even though Bigquery does not exist as a dlt source, dlt makes it simple to write a pipeline that uses Bigquery as a source. How this looks like:

      1. Create a dlt project:

        dlt init bigquery duckdb

        This creates a folder with the directory structure

        ├── .dlt
        │ ├── config.toml
        │ └── secrets.toml
        ├── bigquery.py
        └── requirements.txt
      2. Add BigQuery credentials inside .dlt/secrets.toml.

      3. Add a Python function inside bigquery.py that requests the data.

      4. Load the data by simply running python bigquery.py.

        See the accompanying repo for a detailed step-by-step on how this was done.

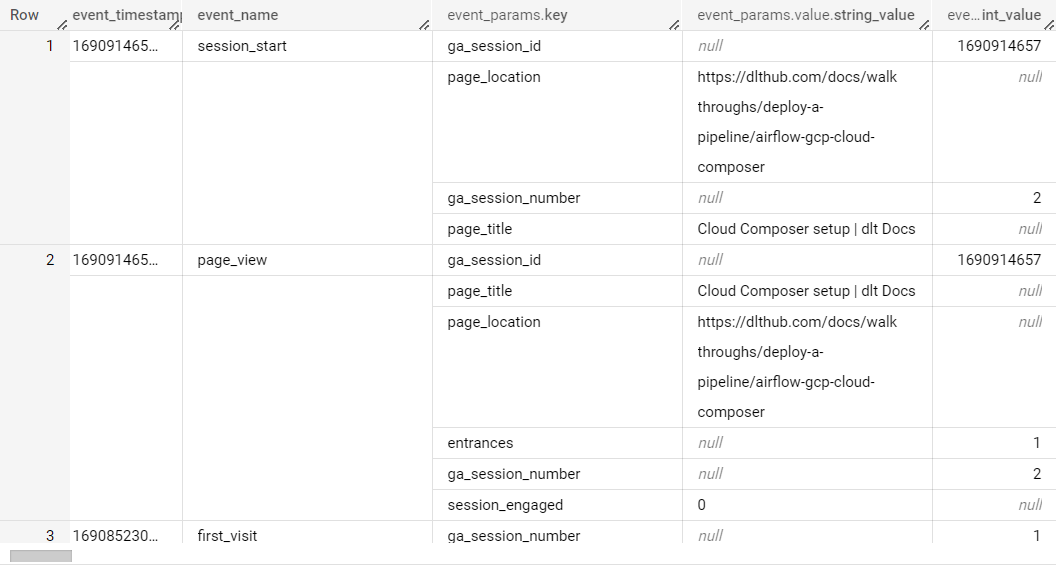
    • The data in BigQuery is nested, which dlt automatically normalizes on loading.

      BigQuery might store data in nested structures which would need to be flattened before being loaded into the target database. This typically increases the challenge in writing data pipelines.

      dlt simplifies this process by automatically normalizing such nested data on load.

      nested-bigquery

      Example of what the nested data in BigQuery looks like.

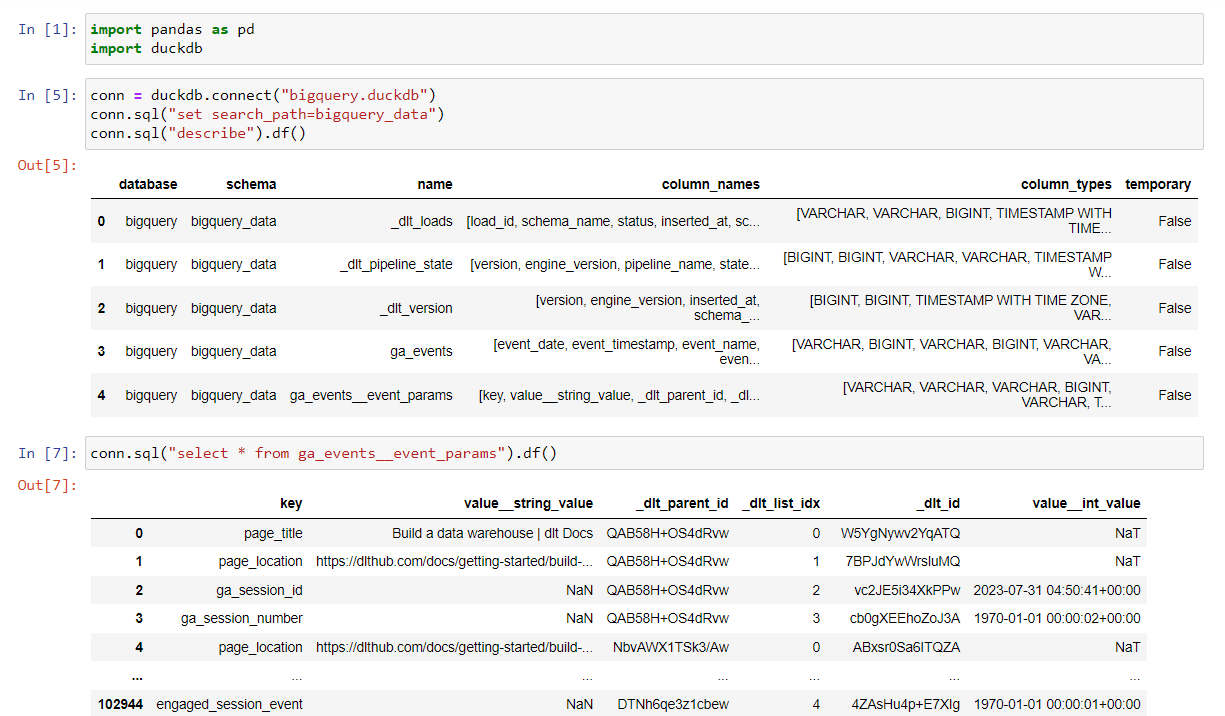
      normalized-bigquery

      dlt loads the main data into table ga_events, and creates another table ga_events__event_params for the nested data.

    • The existing Github source does not load information on stargazers. dlt makes it easy to customize the Github source for this.

      The way the existing GitHub verified source is written, it only loads data on GitHub issues, reactions, comments, and pull requests. To configure it to also load data on stargazers, all I had to do was to add a python function for it in the pipeline script.

      See the accompanying repo for a detailed step-by-step on how this was done.

  2. Using DuckDB as the data warehouse
    DuckDB is open source, fast, and easy to use. It simplifies the process of validating the data after loading it with the data pipeline.

    In this example, after running the BigQuery pipeline, the data was loaded into a locally created DuckDB file called ‘bigquery.duckdb’, and this allowed me to use python to the explore the loaded data:

    duckdb-explore

    The best thing about using DuckDB is that it provides a local testing and development environment. This means that you can quickly and without any additional costs test and validate your workflow before deploying it to production.

    Also, being open source, it benefits from community contributions, particularly dbt-duckdb adapter and the DuckDB Metabase driver, which make it very useful in workflows like these.

  3. dbt for data transformations

    Because of dlt’s dbt runner and DuckDB’s dbt adapter, it was very easy to insert dbt into the existing workflow. What this looked like:

    1. I first installed dbt along with the duckdb adapter using pip install dbt-duckdb .
    2. I then created a dbt project inside the dlt project using dbt init and added any transforms as usual.
    3. Finally, I added the dlt’s dbt runner to my python script, and this configured my pipeline to automatically transform the data after loading it. See the documentation for more information on the dbt runner.
  4. Metabase for the dashboard

    Metabase OSS has a DuckDB driver, which meant that I could simply point it to the DuckDB files in my system and build a dashboard on top of this data.

    dashboard-1

    dashboard-2

    dashboard-3

    dashboard-4

  5. Going to production: Using MotherDuck as the destination

    So far the process had been simple. The integrations among dlt, dbt, DuckDB, and Metabase made the loading, transformation, and visualization of data fairly straight-forward. But the data loaded into DuckDB existed only in my machine, and if I wanted share this data with my team, then I needed to move it to a different storage location accessible by them.

    The best and the easiest way to do this was to use MotherDuck: a serverless cloud analytics platform built on top of DuckDB, where you can host your local DuckDB databases.

    Why choose MotherDuck

    1. Go from development to production with almost no code re-writing:

      This was my main reason for choosing MotherDuck. MotherDuck integrates with dlt, dbt, and Metabase just as well as DuckDB. And I was able to replace DuckDB with MotherDuck in my pipeline with almost no code re-writing!

      What this process looked like:

      1. First, I modified the dlt pipelines to load to MotherDuck instead of DuckDB as follows:
        1. I added credentials for MotherDuck inside .dlt/secrets.toml
        2. I made a minor update to the code: i.e. just by changing destination = "duckdb" to destination = "motherduck" the pipelines were already configured to load the data into MotherDuck instead of DuckDB
      2. With this change, I was already able to deploy my pipelines with GitHub actions.
      3. After deploying, I simply changed the DuckDB path to the MotherDuck path in Metabase, and then I deployed Metabase on GCP.

      The reason this is great is because it greatly simplifies the development lifecycle. Using DuckDB + MotherDuck, you can develop and test your pipeline locally and then move seamlessly to production.

    2. Very easy to copy local DuckDB databases to MotherDuck

      This was especially useful in this demo. Google Analytics 4 events data is typically large and when fetching this data from BigQuery, you are billed for the requests.

      In this example, after I ran the BigQuery -> DuckDB pipeline during development, I wanted to avoid loading the same data again when deploying the pipeline. I was able to do this by copying the complete local DuckDB database to MotherDuck, and configuring the pipeline to only load new data from BigQuery.

    3. Easy to share and collaborate

      Being able to share data with the team was the main goal behind moving from DuckDB to a cloud data warehouse. MotherDuck provides a centralized storage system for the DuckDB databases which you can share with your team, allowing them to access this data from their own local DuckDB databases.

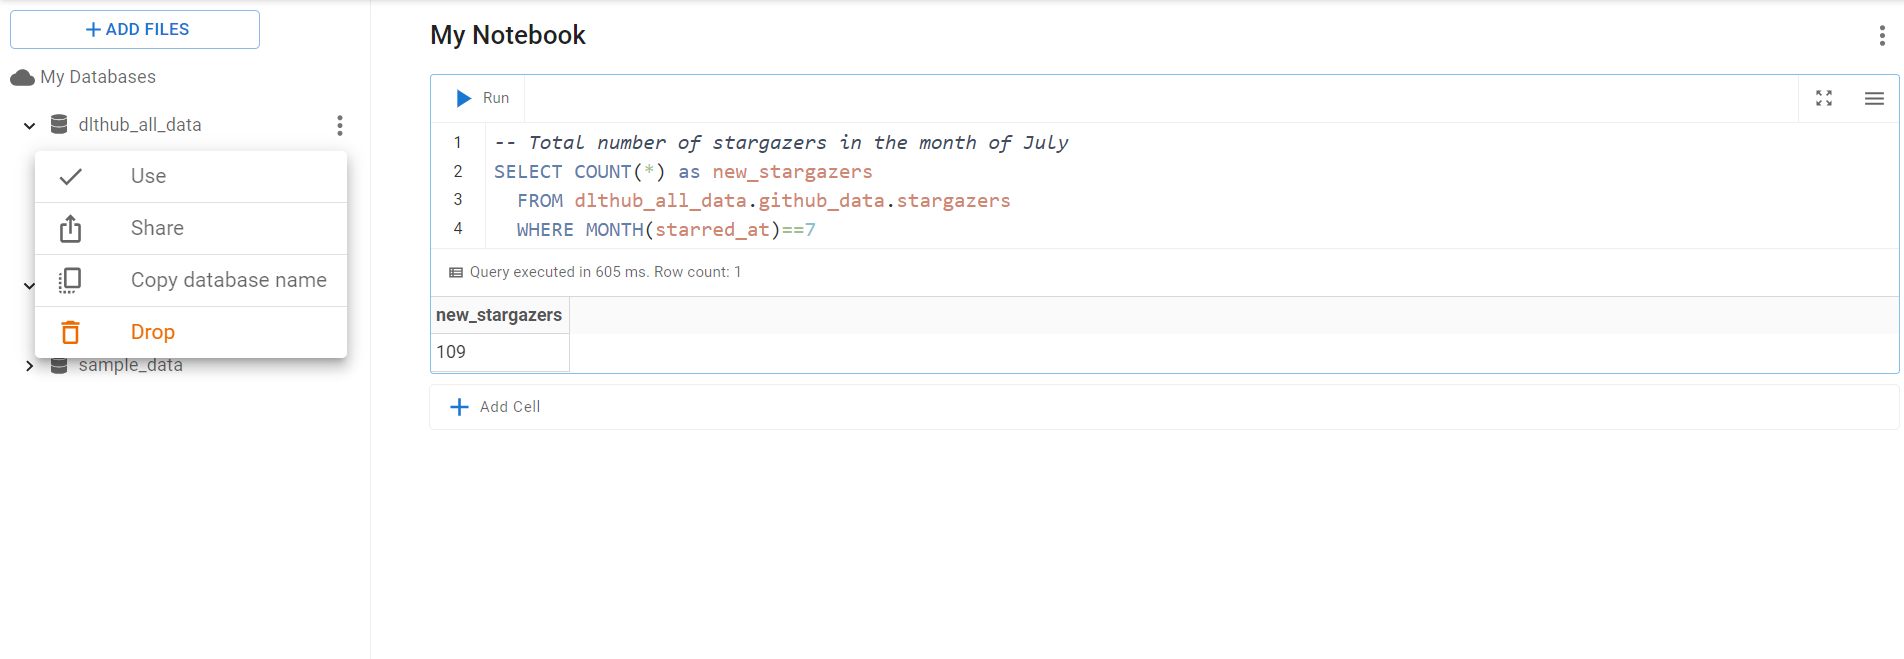
      In my example, after I load the data to MotherDuck, I can provide access to my team just by clicking on ‘Share’ in the menu of their web UI.

      motherduck-share

Conclusion:

This was a fun and interesting exercise of creating a simple, yet powerful Modern Data Stack in a box. For me the biggest positives about this approach are:

  1. Everything was happening on my laptop during the development giving me full control. Still going to production was seamless and I didn't need to change my code and data transformations at all.
  2. I really liked that I could come with my ideas on what data I need and just write the pipelines in Python using dlt. I was not forced to pick from a small pull of existing data extractors. Both, customizing code contributed by others and writing my bigquery source from scratch, were fun and not going beyond Python and data engineering knowledge that I had.
  3. I'm impressed by how simple and customizable my version of MDS is. dlt, DuckDB, and MotherDuck share similar philosophy of giving full power to the local user and and making it easy to interact with them in Python.

I repeat this entire process for the BigQuery pipeline in this video:

This demo works on codespaces. Codespaces is a development environment available for free to anyone with a Github account. You'll be asked to fork the demo repository and from there the README guides you with further steps.
The demo uses the Continue VSCode extension.

Off to codespaces!

DHelp

Ask a question

Welcome to "Codex Central", your next-gen help center, driven by OpenAI's GPT-4 model. It's more than just a forum or a FAQ hub – it's a dynamic knowledge base where coders can find AI-assisted solutions to their pressing problems. With GPT-4's powerful comprehension and predictive abilities, Codex Central provides instantaneous issue resolution, insightful debugging, and personalized guidance. Get your code running smoothly with the unparalleled support at Codex Central - coding help reimagined with AI prowess.